Intro

Welcome to my page. I'm an aspiring Data Scientist who loves to work with all types of information but especially sports and weather data specifically. I received my Bachelors degree from Michigan State University in Finance with a minor in economics and have been working in the U.S. Derivatives Industry in Regulation since graduation. My interests have since taken me to the development and data world where I am currently finishing my Masters in Data Science focusing on Computational Methods at DePaul University in Chicago, IL.
Here you'll find a number of my favorite projects I've worked on. I hope you find them as interesting as me!
Text Analytics
Python
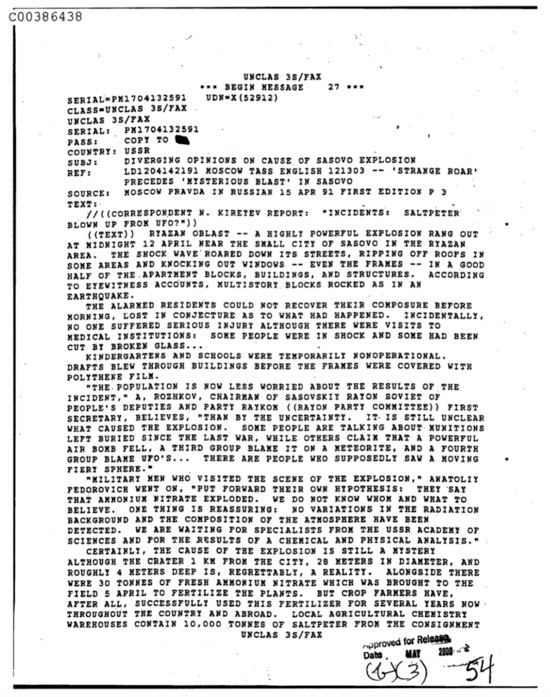
Project Goals:
The goal of this project was to determine if there is any discernable pattern within the recently declassified documents provided by the CIA regarding Unidentified Flying Objects (“UFOs”). Specifically, there were a total of 2,780 documents that were recently released, each classified by the CIA as they contained potentially sensitive information. Our project was designed to discover if there were any patterns amongst the documents such that they could be classified into categories of similarity. The result would describe those documents that are most likely going to provide pertinent information related to the CIAs intelligence on UFOs. Our assumption is that if the majority of documents end up together in one particular grouping (class) then those documents are the vital documents containing a propensity of the meaningful information. Documents belonging to other classes would have some similarity amongst themselves but would be of a lower likelihood of containing pertinent information on the CIAs intelligence on UFOs.
Results:
We had stated that at the outset our prediction had been that amongst the entirety of all the documents released by the CIA on UFOs only a portion of that documentation would contain any pertinent information. Our goal was to identify those documents specifically and present them as targets for potential future analysis. We conducted Kmeans Clustering and KNN Classification on both TFxIDF and PCA approaches. The end result was inline with our predictions, a large majority of the sampled documents fell into one cluster. Specifically of the 670 documents that were analyzed, a total of 610 fell into one cluster and as such should be deemed relevant for review. A future analysis should be done on the 610 identified documents.
Report Here
Code Here
Correspondence Analysis
R Studio
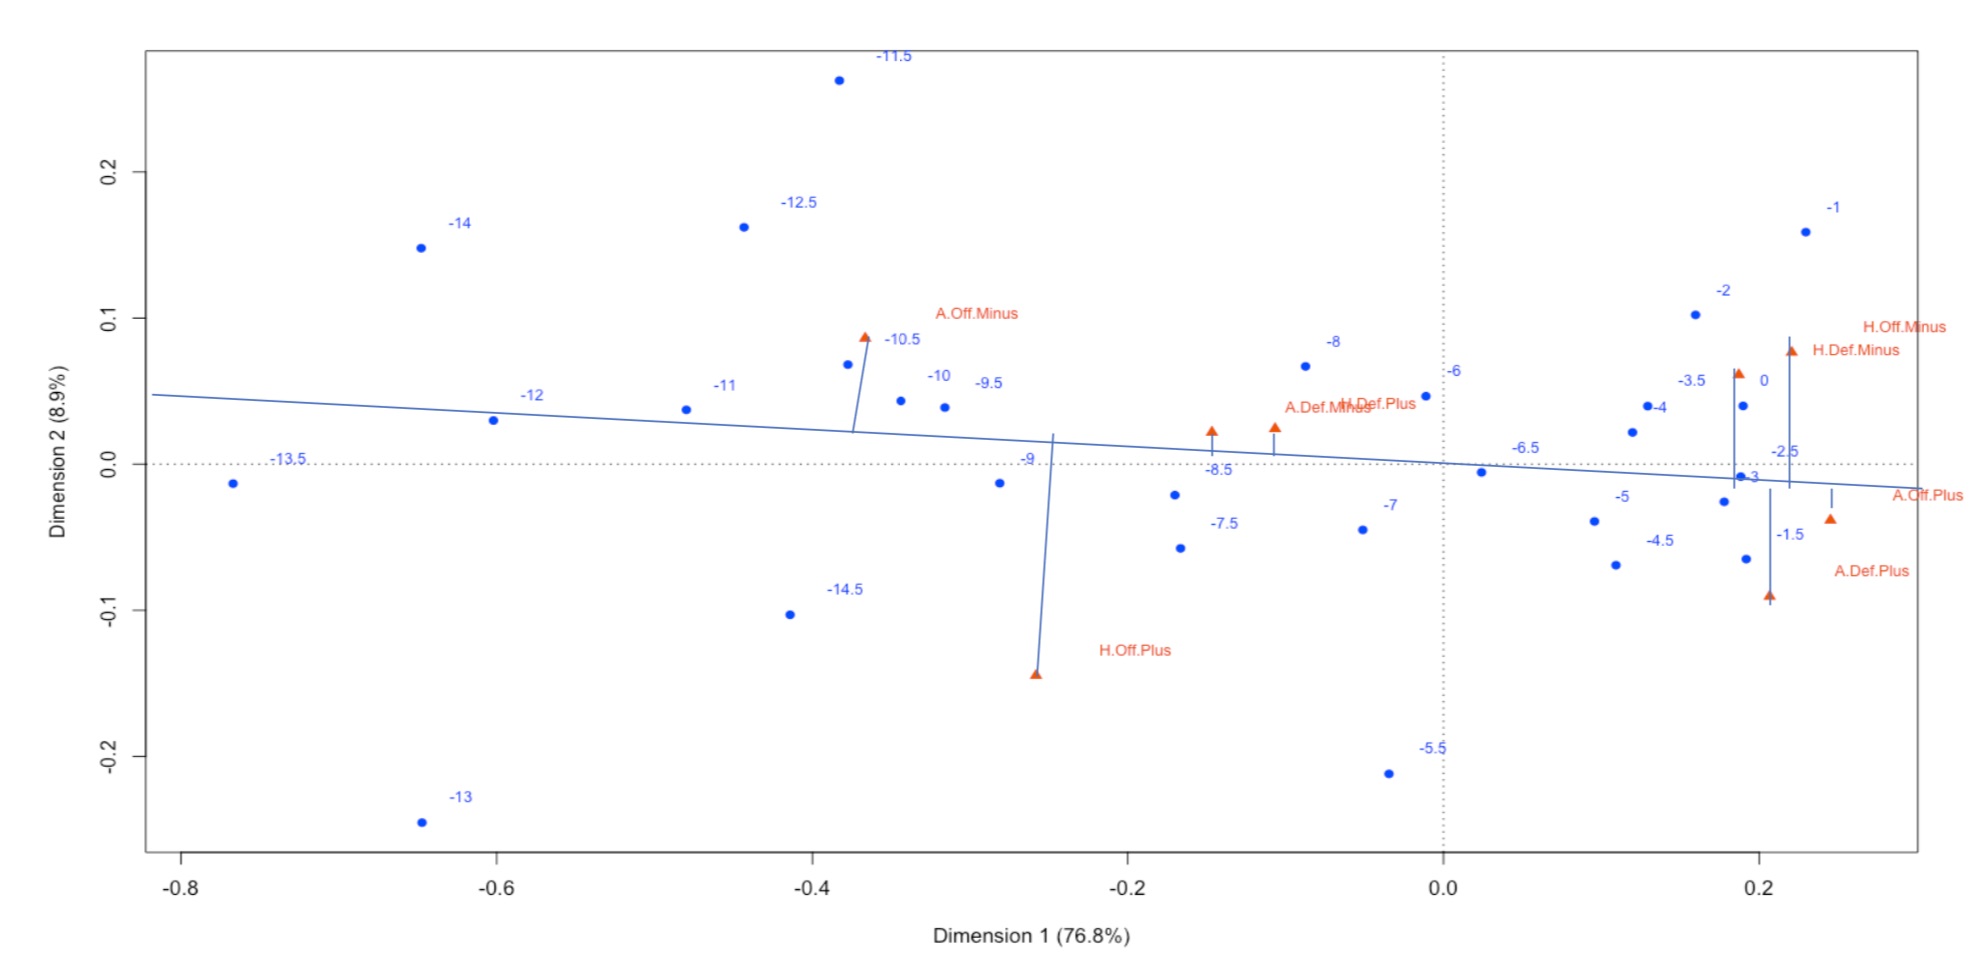
Project Goals:
The goal of this project was to attempt to summarize and interpret categorical variables of interest in our dataset. The data consisted of information regarding every regular season NFL game from 2000-2017, including the closing spread line of each game. More specifically, I looked at the relationship between each team type (above average offensively, below average defensively, etc.) vs the region of the US the game was played in as well as the relationship between the spread of the game vs. the team types playing. Using what we've found with these relationships, we can use this knowledge to identify bad lines offered by sportsbooks and how geographic location is related to measured offensive and defensive talent.
Results:
It was found that the East region played host to home teams with above average offenses and defenses more often than expected. The East region also played host to home teams with below average defenses less often than average. The South region illustrated almost exactly opposite results as the East region. In terms of how each team type relates to the pregame betting spread, home teams with below average offenses and defenses playing against away teams with above average offenses and defenses correspond highly with -3 lines. Smaller lines (i.e. -1 through -6.5) correspond highly to home teams with below average offenses and defenses and away teams with above average offenses and defenses. On the other hand, larger lines (> -7) show an acute directional relationship to away teams with below average offenses.
Report Here
Code Here
Classification
R Studio
Project Goals:
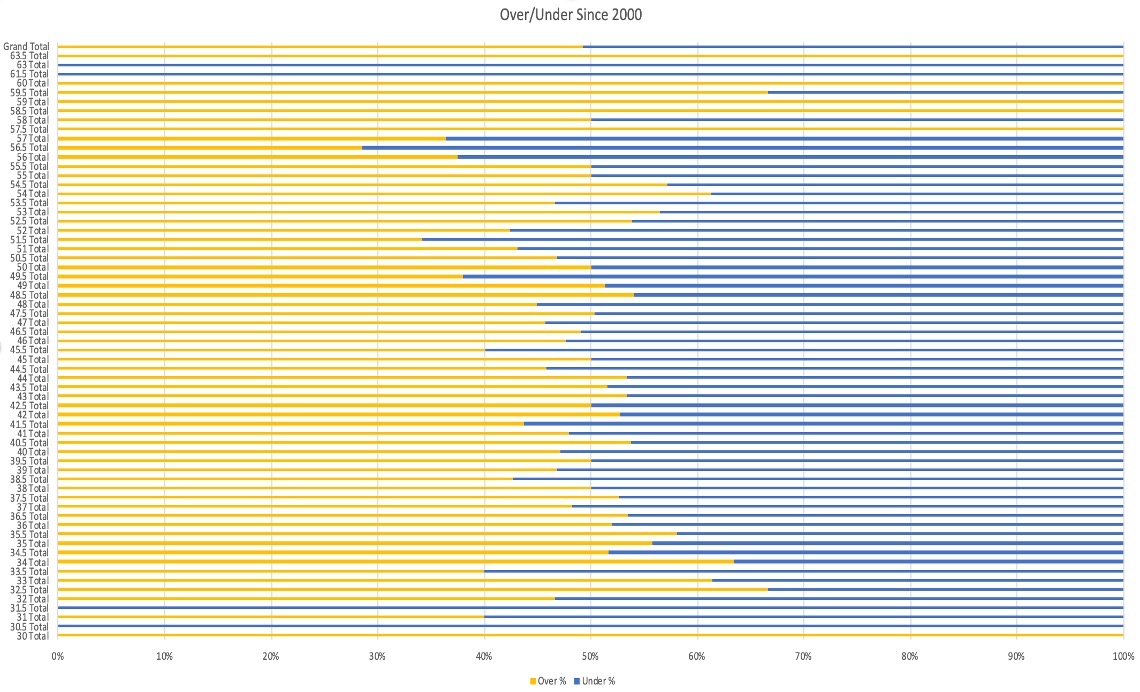
Throughout the industry, the magic number in sports betting is 52.4%. This is the golden win rate that all sports bettors strive for. You might ask: why not 51%? Well, on a typical NFL bet, the sportsbook factor in a vig which is essentially a 10% deposit on the amount you bet that you will get refunded if you win your bet, but you will lose if you lose your bet. Because of the vig, one must strive for a 52.4% win rate. This is the metric my model will be striving for in terms of accuracy. The goal of this model is to take in as much pregame information as I can regarding the game over the last 20 years, and see if I can identify if certain pregame factors can tell me which side of the O/U is more likely to hit. I will be using a classification model as I am are trying to predict the non-numeric result of if I should bet over, or under the O/U total for the game.
Results:
| Model | Accuracy |
| Decision Tree | 49.41% |
| Decision Tree (Pruned) | 48.15% |
| K-Nearest Neighbor | 48.28% |
| Naive Bayes | 51.45% |
None of my models performed up to our positive expected value benchmark of 52.4% accuracy. Looking back, this is most likely due to the complexity of the variables in the dataset. However, the fact that each model was within 2% of 50% accuracy is impressive to me and illustrates that there is something to predicting O/U totals in NFL games. Perhaps weather does not have as big of an impact on point totals in football games as I initially believed. If we were to revisit this in the future, I would actually like to incorporate some regression analysis into the specific O/U totals set for each game to see if we can identify certain totals that lean one way or the other more often that we can try and narrow our classifier on. Perhaps we could look more into the variable importance for each model and cut the amount of variables used in each model in half. If we actually take a closer look at each O/U total from every NFL game from the past 20 years, it’s incredible to note that the Over has hit in 49% of all games and the Under has hit in 51% of all games. This showcases incredible precision by oddsmakers to set these lines so as to not give an edge to one side or the other and partially explains why each of our models were hitting around the 50% mark. Only near the outliers of O/U totals do you see any major lean one way or the other.
Report Here
Code Here
Mapping/Geographic Analysis
ArcGIS
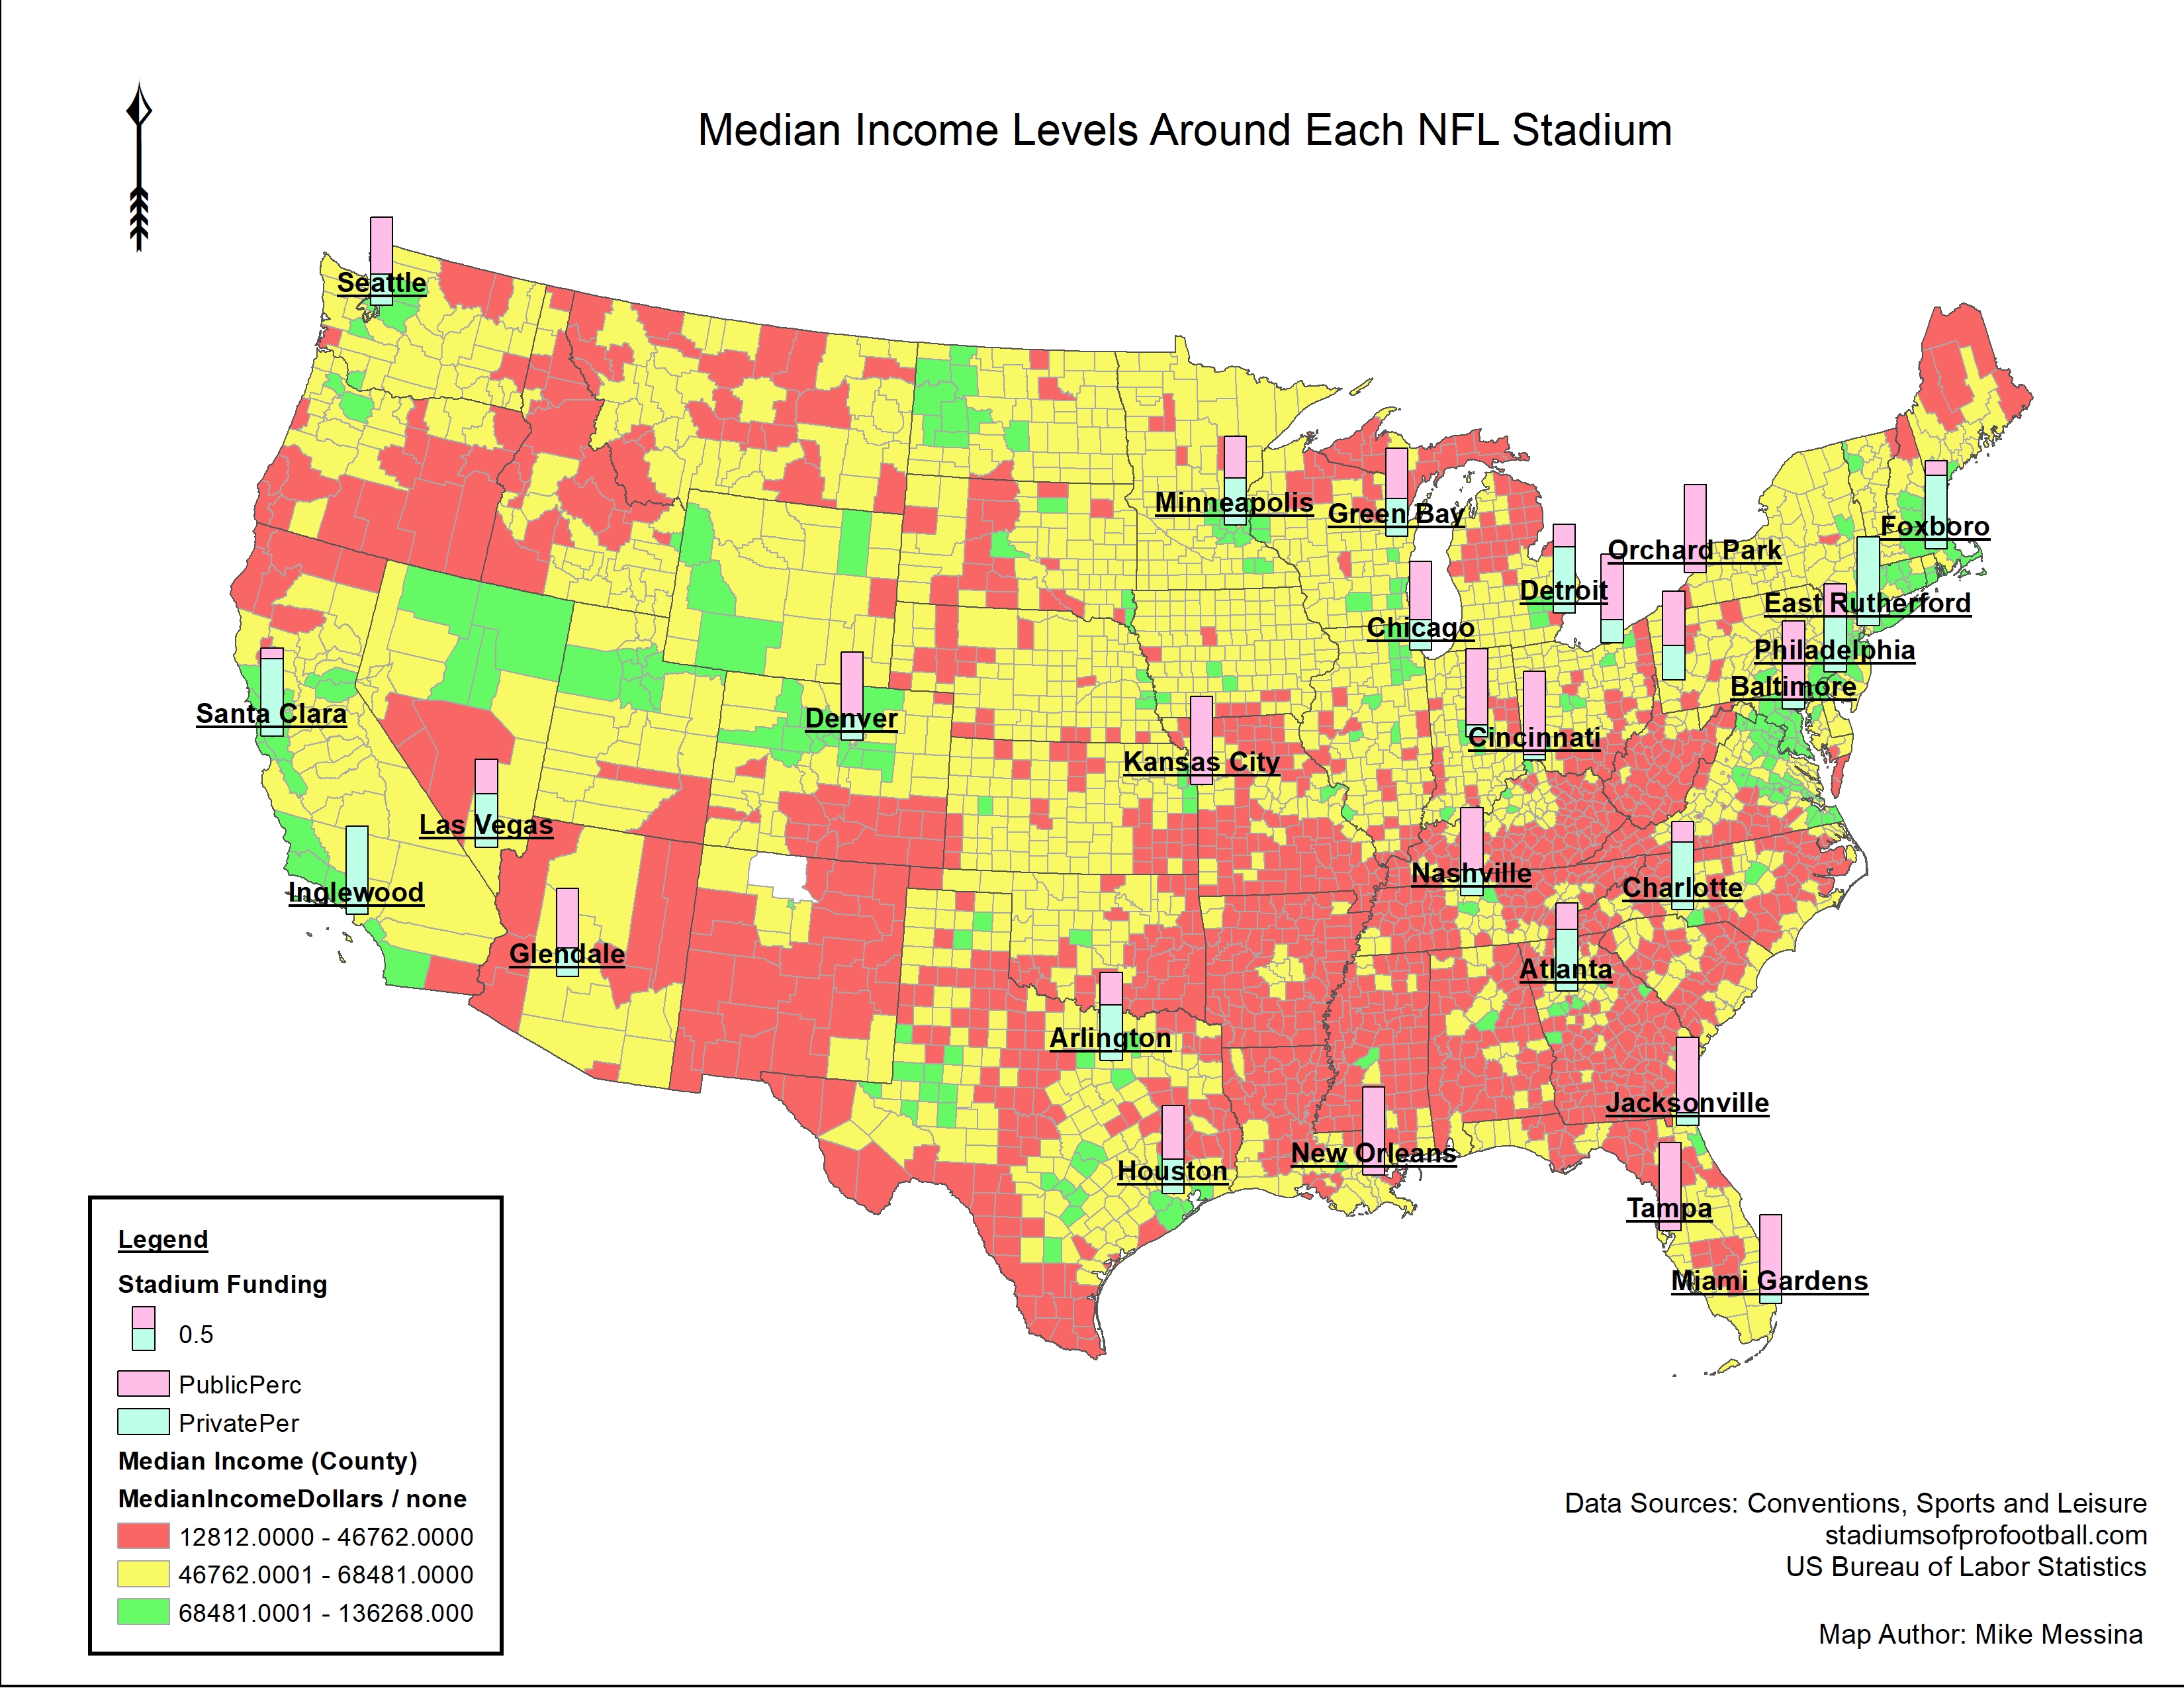
Project Goals:
As each NFL team is owned and operated differently, I want to see if there is any relation to the socioeconomic area a stadium was built to how much of the costs the local taxpayers had to bear in the construction of the stadium. Are the stadium costs more balanced across less economically rich areas? Do wealthy suburbs bear more cost than minority areas of the country? Are some NFL teams more conscious of this than others? These are some of the questions I will attempt to answer here. I want to see if there is any socio or economic disparity here and if anyone is being treated unfairly or being taken advantage of by these uber wealthy NFL owners who can pay for these stadiums personally. On average, every NFL stadium is paid for with 58% of public funds. Given the average stadium costs $525.4 million, this is $304.7 million that the taxpaying public will be paying for whether or not they are even a fan of the team or use the services of the stadium. As there is so much money being allocated to these sometimes-unnecessary stadiums, one would believe these taxpayer funds could be better allocated elsewhere to affect more people directly and in more enriching ways than entertainment.
Results:
While there are no conclusive findings to say that NFL stadiums are being built in areas to take advantage of certain racial demographics or take away from other tax allocations, we can see the southern region of the US is definitely worth our time to examine with a more fine lens given the area is shown to have predominantly black communities with low median incomes while the stadiums in the region are financed using primarily public funding. To take this spatial analysis another step forward, we can also compare regions of the US with stadiums to how taxpayer money is allocated in these areas to regions with no sports stadiums and see how tax revenue is allocated here and look for economic differences that could be caused by stadiums being or not being built.
Report Here
Code Here
About
Education
Michigan State University (2010 - 2014) Bachelors
Major: Finance
Minor: Economics
DePaul University (2019 - 2022) Masters
Major: Data Science - Computational Methods
Professional Experience
National Futures Association (2014 - Current)
Compliance Investigator (2014 - 2018)
Financial Analyst (2018 - 2022)
Programmatic & Yield Analyst (2022 - 2023)
Contact
Elements
Text
This is bold and this is strong. This is italic and this is emphasized.
This is superscript text and this is subscript text.
This is underlined and this is code: for (;;) { ... }. Finally, this is a link.
Heading Level 2
Heading Level 3
Heading Level 4
Heading Level 5
Heading Level 6
Blockquote
Fringilla nisl. Donec accumsan interdum nisi, quis tincidunt felis sagittis eget tempus euismod. Vestibulum ante ipsum primis in faucibus vestibulum. Blandit adipiscing eu felis iaculis volutpat ac adipiscing accumsan faucibus. Vestibulum ante ipsum primis in faucibus lorem ipsum dolor sit amet nullam adipiscing eu felis.
Preformatted
i = 0;

while (!deck.isInOrder()) {
    print 'Iteration ' + i;
    deck.shuffle();
    i++;
}

print 'It took ' + i + ' iterations to sort the deck.';
Lists
Unordered
- Dolor pulvinar etiam.
- Sagittis adipiscing.
- Felis enim feugiat.
Alternate
- Dolor pulvinar etiam.
- Sagittis adipiscing.
- Felis enim feugiat.
Ordered
- Dolor pulvinar etiam.
- Etiam vel felis viverra.
- Felis enim feugiat.
- Dolor pulvinar etiam.
- Etiam vel felis lorem.
- Felis enim et feugiat.
Icons
Actions
Table
Default
| Name |
Description |
Price |
| Item One |
Ante turpis integer aliquet porttitor. |
29.99 |
| Item Two |
Vis ac commodo adipiscing arcu aliquet. |
19.99 |
| Item Three |
Morbi faucibus arcu accumsan lorem. |
29.99 |
| Item Four |
Vitae integer tempus condimentum. |
19.99 |
| Item Five |
Ante turpis integer aliquet porttitor. |
29.99 |
|
100.00 |
Alternate
| Name |
Description |
Price |
| Item One |
Ante turpis integer aliquet porttitor. |
29.99 |
| Item Two |
Vis ac commodo adipiscing arcu aliquet. |
19.99 |
| Item Three |
Morbi faucibus arcu accumsan lorem. |
29.99 |
| Item Four |
Vitae integer tempus condimentum. |
19.99 |
| Item Five |
Ante turpis integer aliquet porttitor. |
29.99 |
|
100.00 |